What problems it solves
No visibility into AI adoption
Developers use Cursor, Copilot, Claude, and others — but there’s no central view. AI Lineage aggregates everything into one dashboard without requiring any workflow changes.
Can't measure AI ROI
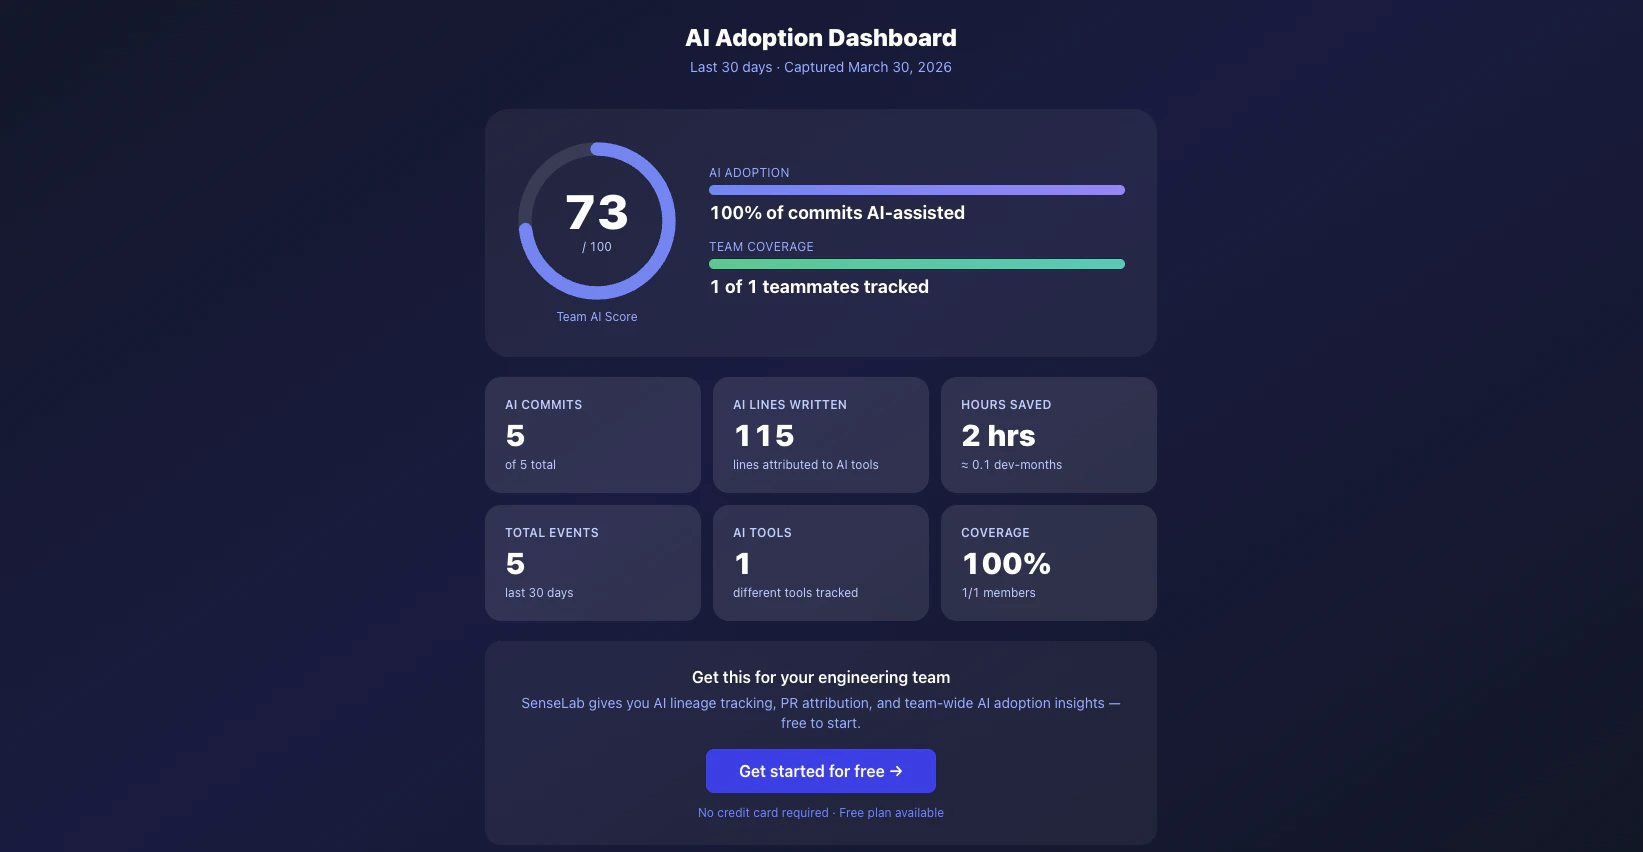
Hours saved, commits assisted, lines attributed — AI Lineage quantifies what AI is actually contributing so you can make the case (or course-correct) with data.
Unknown tool and model sprawl
Without lineage tracking, you don’t know which AI tools or models your team is using. AI Lineage surfaces the full picture — including tools you didn’t know were in use.
No audit foundation
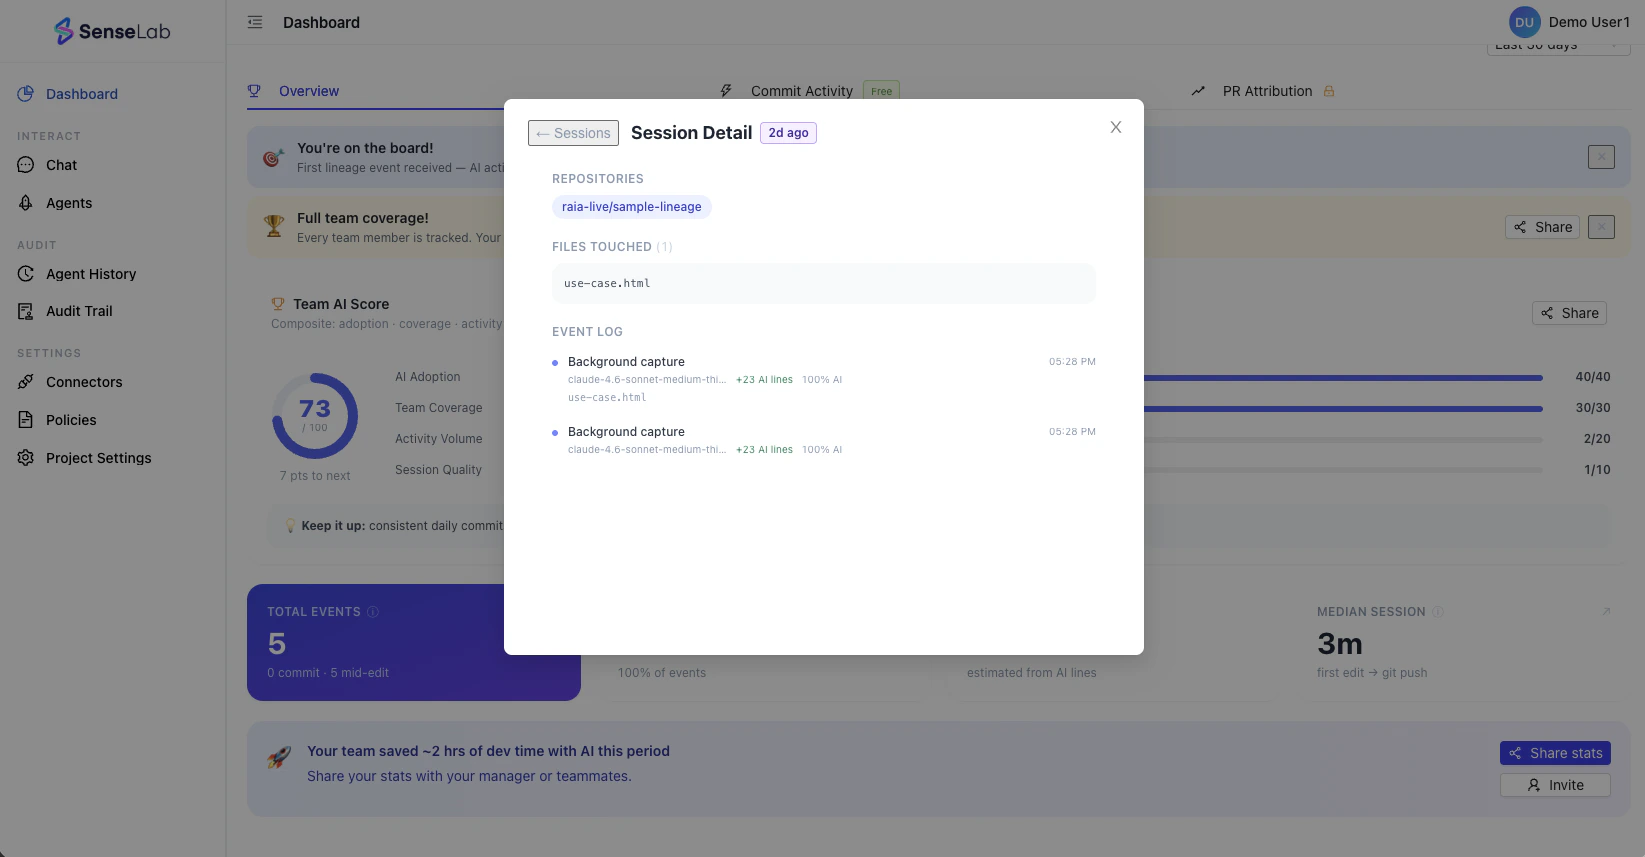
Every sprint without lineage tracking is a sprint you’ll never be able to audit. AI Lineage is the foundation — the record you’ll need when compliance, legal, or an enterprise customer comes asking.
What’s in the dashboard
Overview — Team AI Score
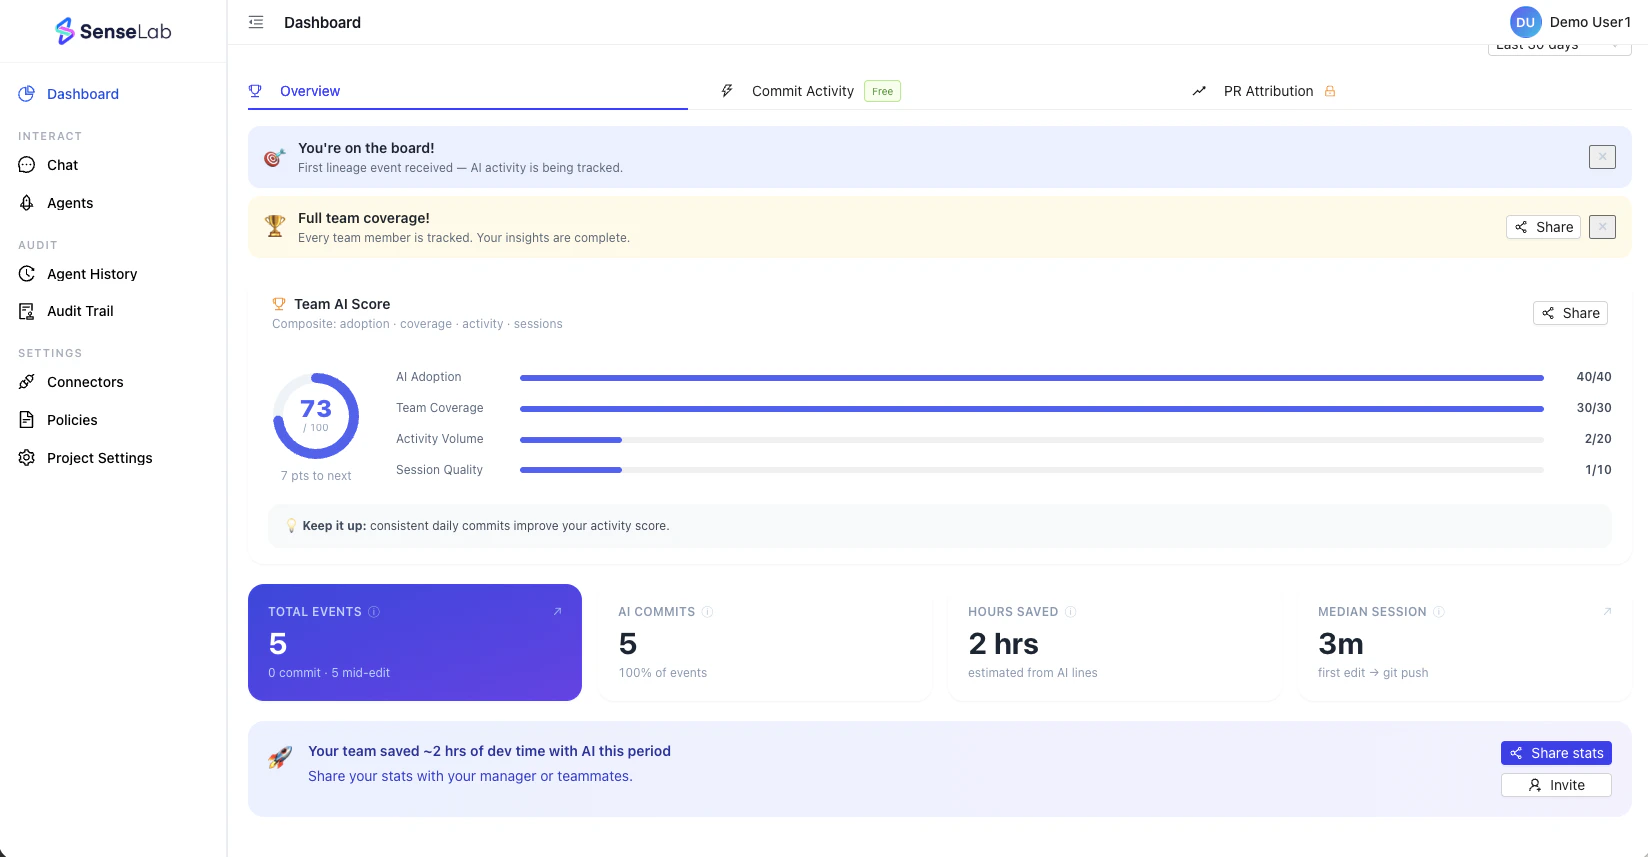
| Dimension | What it measures | Max points |
|---|---|---|
| AI Adoption | % of commits that are AI-assisted | 40 |
| Team Coverage | % of the team being tracked | 30 |
| Activity Volume | Volume of AI-assisted edits and commits | 20 |
| Session Quality | Depth and consistency of AI coding sessions | 10 |
Commit Activity — 3D Activity View
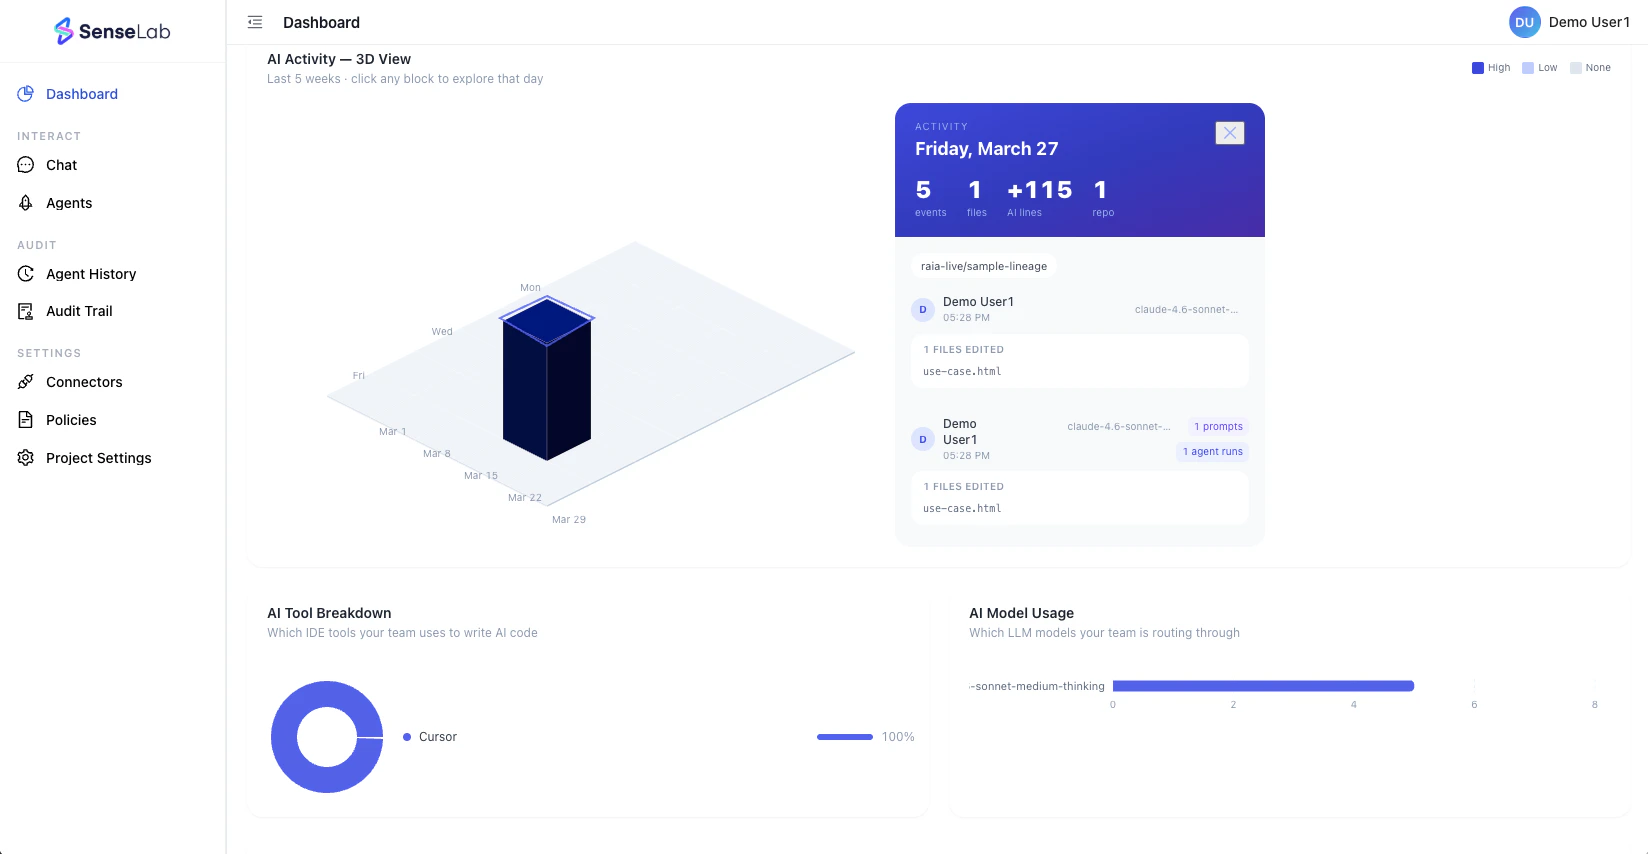
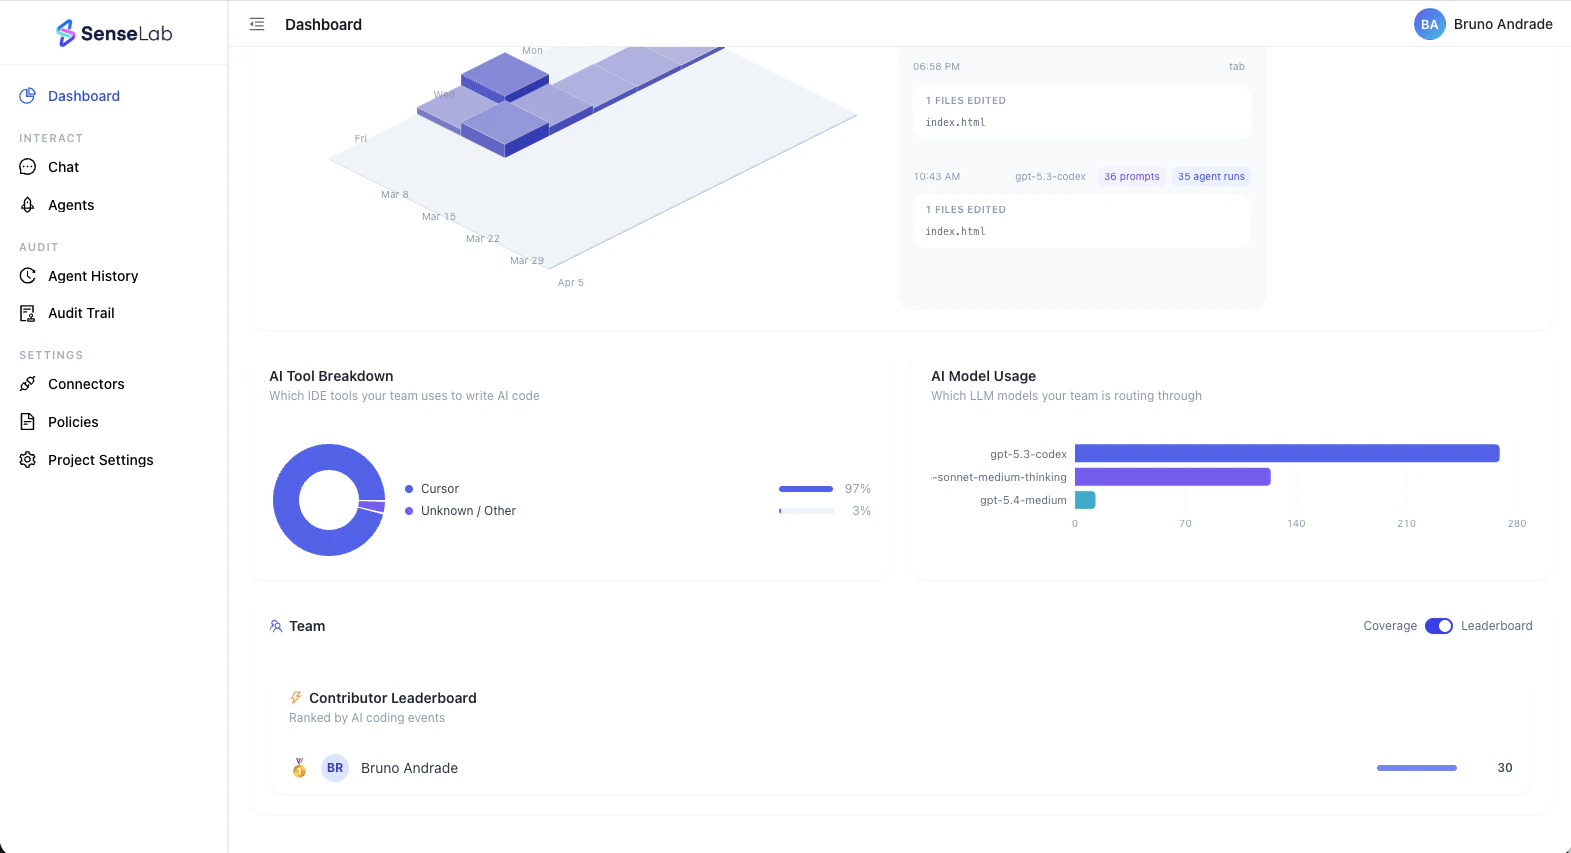
AI Tool Breakdown and Model Usage
- AI Tool Breakdown — which IDEs and AI coding tools (Cursor, Copilot, Claude Code, Windsurf, etc.) are driving output, and in what proportion
- AI Model Usage — which LLMs your team is routing through (GPT-4o, Claude, Gemini, etc.) and how heavily each is used
Team Coverage and Leaderboard
Shareable Adoption Dashboard